
Azure Sponsorship cost analyzer

TL;DR
Go to the canalyzer repository to use the tool and get some insights on your subscription consumption.
The problem
We, at Indimin, are proud of our relations with the major cloud providers. This allows us to give our customers the best experience with our products and lower monthly costs for their tenants. We deploy on our customer’s tenant because of the nature of our products and security reasons. While we gained reputation and experience we were granted sponsorship credits to bust our business to the next level.
Today we will be focusing on the Microsoft Azure Sponsorship Program and the Microsoft Sponsorship Subscription created and linked with the credits. While these credits are great to our Developer Team, we encounter an issue: This type of subscription at this time has no access to the consumption API provided by Azure.
If you try to use the Usage List command from the azure cli will output:
1
2
3
$ az consumption usage list
Command group 'consumption' is in preview and under development. Reference and support levels: https://aka.ms/CLI_refstatus
(422) Cost Management supports only Enterprise Agreement, Web direct and Microsoft Customer Agreement offer types. Subscription <YOUR_SUBSCRIPTION_ID> is not associated with a valid offer type. Cost Management supports only Enterprise Agreement, Web direct and Microsoft Customer Agreement offer types. Subscription <YOUR_SUBSCRIPTION_ID> is not associated with a valid offer type. (Request ID: <REQUEST_ID>)
The same with any other consumption related command (with same or similar output)
Using the Sponsorship Dashboard we can see total credits usage and by-resource usage. But how about resource groups usage or specific resource usage.
We have multiple projects and multiple resource groups but we don’t have easy access to costs or usage. Of course, we can use the Azure Pricing Calculator but it’s a manual job. This feature is supposed to be available for this kind of subscription, but this was announced years ago.
The solution
Microsoft has an Azure SDK for Python available and a Retail Prices REST API. So, why not create a tool and generate a report of the subscription consumption?, and then send it to the interested coworkers, like the IT Manager and Finance Manager.
CAnalyzer has born, and it’s Open Source. Even has a Docker Image ready to use on your CI Pipeline.
CAnalyzer requires a valid service principal with Reader role across the entire subscription. This script allows you to do that:
1
az ad sp create-for-rbac --name "CAnalyzer" --role "Reader" --sdk-auth true
The client_id, secret, tenant_id, and subscription_id needs to be saved on:
appsettings.json configuration file:
1
2
3
4
5
6
7
{
  "clientId": "service-principal-client-id",
  "clientSecret": "super-secret-value",
  "subscriptionId": "12345678-1234-1234-1234-12345678912345",
  "tenantId": "abc1234567-2abc-1abc-abcd-123456789123",
}
Or Environment variables:
CANALYYZER_CLIENT_ID="service-principal-client-id",
CANALYYZER_CLIENT_SECRET="super-secret-value",
CANALYYZER_SUBSCRIPTION_ID="12345678-1234-1234-1234-12345678912345",
CANALYYZER_TENANT_ID="abc1234567-2abc-1abc-abcd-123456789123",
CAnalyzer is composed of 3 tools:
Analyzer
Scan the subscription’s resource groups (or a specific resource group using the cli -r option)
For every resource group fetchs the resources and try to get the retail price using the Azure Retail Prices REST API, then generate a markdown report with this information. It will looks like this:
1
2
3
4
5
6
7
8
9
10
11
12
13
14
$ python ./canalyzer/analyzer/ --help
Usage: python -m  [OPTIONS]

Options:
  -d, --detail                 [x>=0]
  -r, --resource-group TEXT
  -o, --output TEXT
  -f, --format [markdown|csv]
  --version
  --help                       Show this message and exit.

$ python ./canalyzer/analyzer/ -f markdown -r resource-group-1 -r resource-group-2 -r resource-group-3 -o report
...
$ cat report.md
1
2
3
4
5
6
7
8
9
10
11
12
13
14
15
16
17
18
19
20
21
22
23
24
25
26
27
28
29
30
31
32
33
34
35
36
37
38
39
40
41
42
43
44
45
46
47
48
49
50
51
52
53
54
55
56
# Azure Cost Analysis - Microsoft Azure Sponsorship
Created at: Jul 15 2021 15:48:05

[TOC]

## Resources Table
|Resource Group|Location|Price|
|----|----|----------|
|resource-group-1|eastus2|14.738787|
|resource-group-2|eastus2|29.474529|
|resource-group-3|eastus2|252.015783|

**Approximate minimum monthly total: USD 296.2291**

## Resource Group - resource-group-1
* Tags:
	* Tag1: Value1
	* Tag2: Value2
	* Tag3: Value3

**Monthly Price: USD 14.738787**

### Resources Table
|Name|Type|Created At|Price|
|----|----|----------|-----|
|db1||Microsoft.Sql/servers/databases|Apr 26 2021 19:46:01|14.738787|
|master|Microsoft.Sql/servers/databases|Apr 26 2021 19:46:04|None|

## Resource Group - resource-group-2
* Tags:
	* Tag1: Value1
	* Tag2: Value2
	* Tag3: Value3

**Monthly Price: USD 29.474529**

### Resources Table
|Name|Type|Created At|Price|
|----|----|----------|-----|
|db|Microsoft.Sql/servers/databases|Jun 24 2021 18:54:32|29.474529|
|master|Microsoft.Sql/servers/databases|Jun 24 2021 18:54:47|None|

## Resource Group - resource-group-3
* Tags:
	* Tag1: Value1
	* Tag2: Value2
	* Tag3: Value3

**Monthly Price: USD 252.015783**

### Resources Table
|Name|Type|Created At|Price|
|----|----|----------|-----|
|db1|Microsoft.Sql/servers/databases|Apr 24 2020 15:56:41|222.541254|
|master|Microsoft.Sql/servers/databases|Apr 23 2020 23:16:33|None|
|db2|Microsoft.Sql/servers/databases|Apr 23 2020 23:16:39|29.474529|
The
[TOC]tag will be rendered when converting to HTML later on
Markdown to HTML
The markdown format is great to easily write the analysis to file keeping some structure. But, we can make it better. And nothing better than HTML.
We can show HTML on any web page or send beautiful emails.
This tool does this for us: takes a markdown file as input and generate to HTML files:
- Entire analysis without change
- A report summary: contains only the first table with all resource groups and monthly prices.
We will use the markdown_to_html tool to do this:
1
2
3
4
5
6
7
8
9
10
11
12
13
$ python ./canalyzer/markdown_to_html/ --help
Usage: python -m  [OPTIONS] INPUT_FILE

Options:
  -o, --output TEXT
  --with-summary
  --css TEXT
  --premailer
  --help             Show this message and exit.

$ python ./canalyzer/markdown_to_html/ --with-summary --premailer --css styles.css -o html_report report.md
$ ls
html_report.html html_report_summary.html report.md
SMTP
This little tool will handle the SMTP email, including a rich HTML body and attachments. All configured using:
appsettings.json configuration file:
1
2
3
4
5
6
7
8
9
10
11
{
  "smtp": {
    "subject": "Azure Cost Analysis",
    "from_address": "Azure Cost Analyzer Bot <[email protected]>",
    "to_address": "[email protected]",
    "host": "smtp.gmail.com",
    "port": "465",
    "user": "[email protected]",
    "password": "user_secret_password"
  }
}
Or Environment variables:
CANALYZER_SMTP_SUBJECT="Azure Cost Analysis",
CANALYZER_SMTP_FROM_ADDRESS="Azure Cost Analyzer Bot <[email protected]>",
CANALYZER_SMTP_TO_ADDRESS="[email protected]",
CANALYZER_SMTP_HOST="smtp.gmail.com",
CANALYZER_SMTP_PORT="465",
CANALYZER_SMTP_USER="[email protected]",
CANALYZER_SMTP_PASSWORD="user_secret_password"
HTML is nice for rich emails but is suitable for reading the actual report. We can do this using the wkhtmltopdf tool, included on the Docker Image:
1
2
3
4
5
6
7
8
9
$ wkhtmltopdf html_report.html report.pdf
Loading pages (1/6)
Counting pages (2/6)
Resolving links (4/6)
Loading headers and footers (5/6)
Printing pages (6/6)
Done
$ ls
html_report.html html_report_summary.html report.md report.pdf
We are ready to send the report:
1
2
3
4
5
6
7
python ./canalyzer/smtp/ --help
Usage: python -m  [OPTIONS] HTML_BODY PLAIN_BODY

Options:
  -a, --attach TEXT
  --help             Show this message and exit.
$ python ./canalyzer/smtp/ html_report_summary.html report.md  -a output.pdf
Four simple steps to get a nice report. But what about automation?
CI Automation
We wanted to generate this report every month and send it to some interested coworkers, but we didn’t want to do this manually. Using the Docker Image, we could use many approaches to this automation, but GitLab CI Pipelines fit our needs.
This is our automation pipeline configuration:
1
2
3
4
5
6
7
8
9
10
11
12
13
14
15
16
17
18

workflow:
  rules:
    - if: '$CI_PIPELINE_SOURCE == "schedule"'

scheduled_report:
  stage: report
  image: registry.gitlab.com/indimin/canalyzer:latest
  script:
    - cat $CANALYZER_APPSETTINGS_PATH > appsettings.json
    - canalyzer -o report -f markdown
    - markdown_to_html report.md  --css styles.css --with-summary --premailer -o html_report
    - wkhtmltopdf html_report.html report.pdf
    - canalyzer_smtp html_report_summary.html report.md -a report.pdf
  rules:
    - if: '$CI_PIPELINE_SOURCE != "schedule"'
  	  when: never
	- when: on_success
This will only run on scheduled pipelines
Using the Schedule Pipeline with cron expression support we scheduled a pipeline:
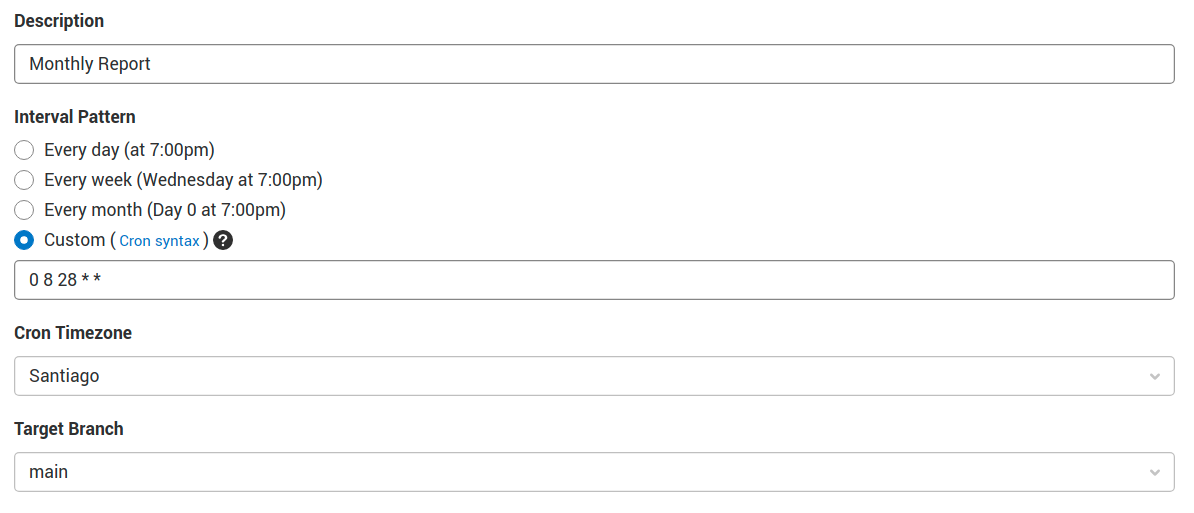
You can use pipeline or project environment variables to configure it to your needs.
The report will be sent monthly every 28th at 8 o’clock.
Anyone is welcome to use this tool, create issues, and contribute to the code.